

Introduction
Your collaborative SaaS platform just landed a promising enterprise account. The initial users are engaged, but something's off. Only 3 out of 15 invited team members are actively using the workspace. The admin hasn't completed domain verification. Invitations are sitting unopened for weeks.
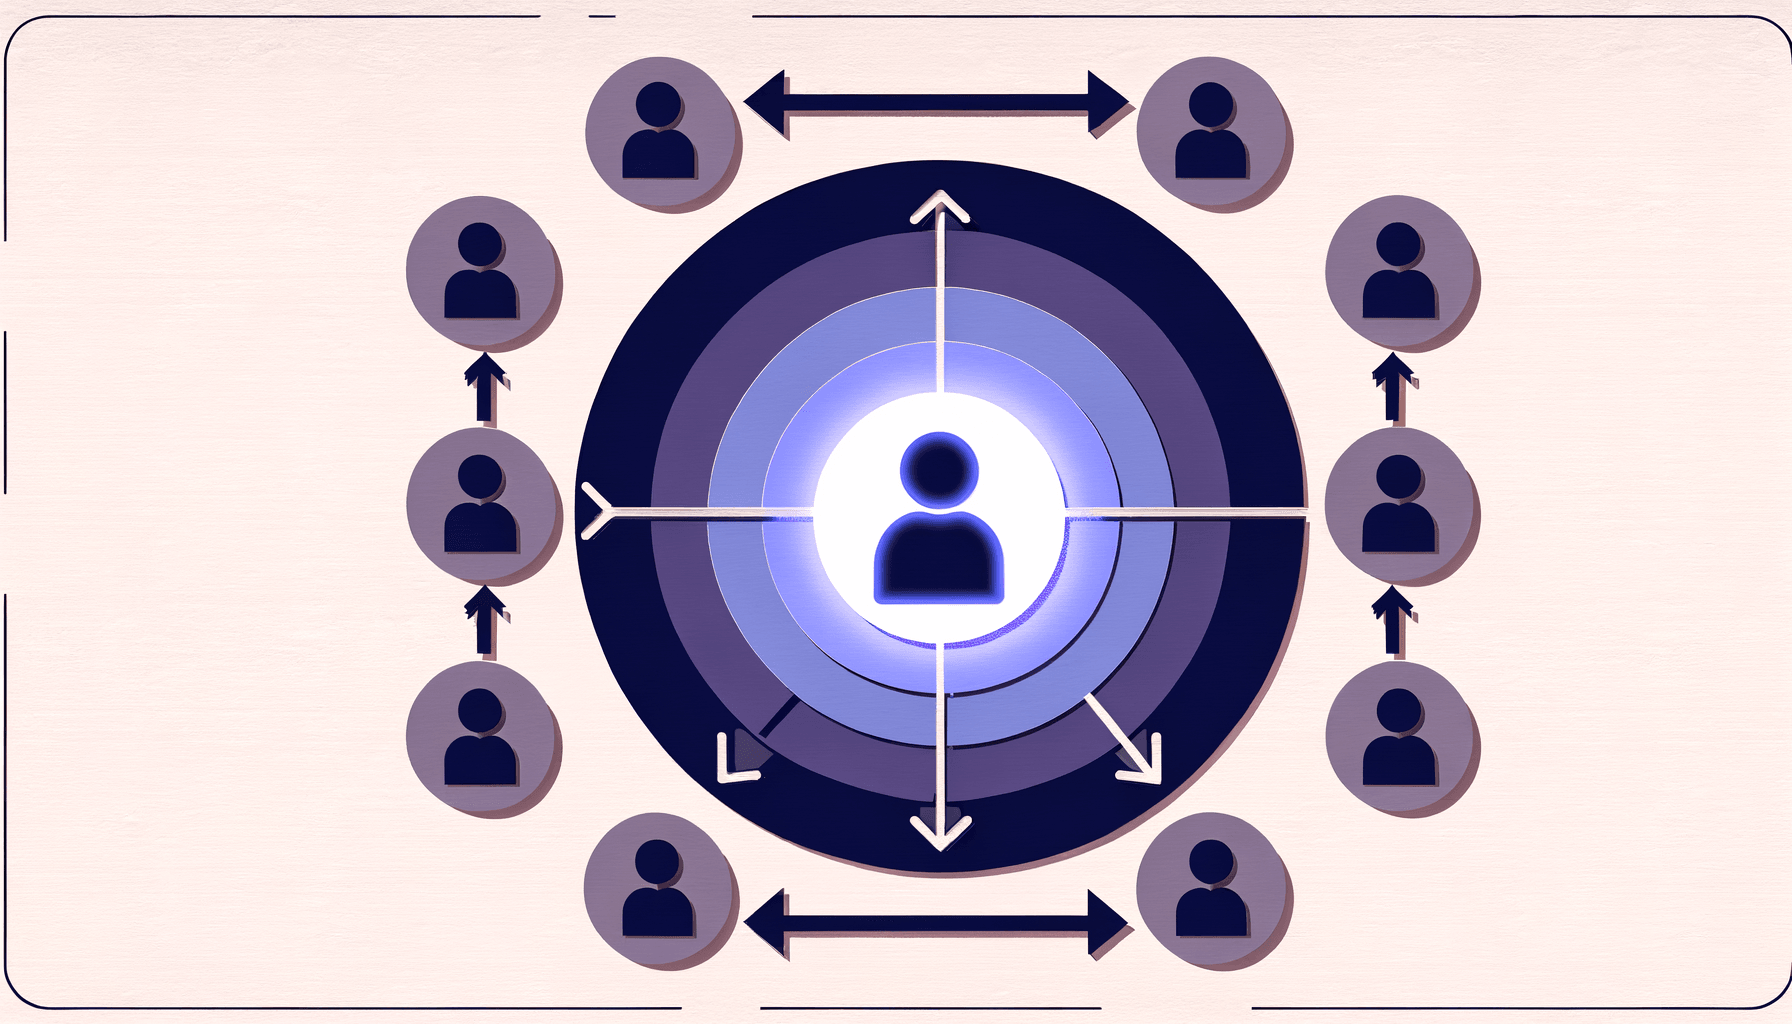
Sound familiar? You're witnessing incomplete team adoption, one of the strongest predictors of churn in collaborative SaaS. While traditional SaaS metrics focus on individual user behavior, collaborative platforms require a fundamentally different approach to measurement and optimization.
This comprehensive guide will show you how to build a team adoption analytics system that identifies expansion opportunities, predicts churn risk, and triggers the right interventions at the perfect moment. Whether you're in customer success, revenue operations, or product analytics, these frameworks will transform how you measure and optimize collaborative platform growth.
The Four Pillars of Team Adoption Metrics
Team Completion Percentage
Your most critical metric is team completion percentage, calculated as active users divided by total invited users within each workspace. Research shows that teams achieving less than 40% completion within 30 days have a 73% higher churn probability.
Track completion across three dimensions:
- Initial completion: Percentage of invited users who complete onboarding
- Active completion: Users who engage with core features weekly
- Feature completion: Teams utilizing collaborative features vs. individual tools
Domain Coverage Analytics
Domain coverage measures how thoroughly your platform penetrates an organization. Calculate this as:
Domain Coverage = (Active users from domain / Total employees with domain email) × 100
High-value signals include:
- Department spread: Multiple departments using the platform
- Hierarchy penetration: Both managers and individual contributors active
- Cross-functional collaboration: Users from different domains collaborating on shared projects
Collaborative Feature Engagement
Unlike traditional SaaS, collaborative platforms derive value from multi-user interactions. Track these engagement patterns:
- Shared workspace creation rate: Teams creating collaborative spaces
- Real-time collaboration sessions: Concurrent users working together
- Cross-user interactions: Comments, mentions, shared documents
- Invitation velocity: How quickly teams expand their user base
Adoption Velocity Tracking
Adoption velocity measures how quickly teams progress through your collaborative maturity model. Monitor:
- Time to first collaboration: Days from signup to first shared activity
- Feature adoption progression: Movement through collaboration features
- Team growth rate: Speed of adding new team members
- Advanced feature uptake: Adoption of premium collaborative tools
Early Warning Signals: Predicting Expansion and Churn
Based on analysis of 250M+ usage records, successful platforms track over 300 proven signals. Here are the highest-impact early warning indicators:
Red Flags: Churn Risk Signals
Incomplete Team Formation
- Less than 50% invitation acceptance within 14 days
- Single-user workspaces persisting beyond trial period
- Admin accounts with minimal collaborative activity
Delayed Invitation Patterns
- Week-over-week decrease in new user invitations
- Invitations sent but not followed up with onboarding support
- High invitation-to-activation time (>7 days average)
Engagement Drop-off Indicators
- Declining real-time collaboration sessions
- Shift from collaborative to individual feature usage
- Reduced cross-user interactions and shared content creation
Green Flags: Expansion Opportunities
Viral Growth Patterns
- Consistent weekly growth in active users per workspace
- Users inviting colleagues from outside their immediate team
- Creation of multiple workspaces within the same domain
Deep Collaboration Signals
- Regular use of advanced collaborative features
- High frequency of cross-departmental projects
- Integration with other business tools in their stack
Analytics Implementation: Building Your Dashboard
Core Metrics Dashboard Layout
Your team adoption dashboard should prioritize these metrics in order of predictive power:
Primary KPIs (Top Row)
- Team Completion Rate: Current vs. target percentage
- Domain Coverage: Penetration across organization
- Adoption Velocity: 30-day rolling average
- Collaboration Depth: Multi-user session frequency
Secondary Metrics (Middle Section)
- Feature adoption progression by team
- Invitation acceptance rates and timing
- Cross-functional usage patterns
- Integration utilization rates
Alert Triggers (Bottom Panel)
- At-risk accounts flagged by algorithm
- Expansion opportunities based on usage patterns
- Automated intervention suggestions
Vortex Team Adoption Scoring
Implement a composite scoring system that weights multiple factors:
Vortex Score = (Team Completion × 0.3) + (Domain Coverage × 0.25) +
               (Feature Engagement × 0.25) + (Adoption Velocity × 0.2)
Score Ranges:
- 90-100: Expansion ready (high upsell probability)
- 70-89: Healthy adoption (monitor for expansion signals)
- 50-69: At risk (intervention needed)
- <50: Critical risk (immediate action required)
Automated Action Triggers
Configure your system to trigger interventions based on specific thresholds:
Immediate Alerts (Real-time)
- Team completion drops below 30%
- No new invitations sent in 14 days
- Domain admin becomes inactive
Weekly Review Triggers
- Adoption velocity decreasing for 2+ weeks
- Collaborative feature usage declining
- Multiple teams within domain showing risk signals
Expansion Opportunity Alerts
- Team completion exceeds 80% with growing invitation rate
- New departments joining from same domain
- Advanced feature adoption increasing
Advanced Analytics: Churn Prevention and Growth Acceleration
Early Signal Detection Systems
Modern collaborative SaaS platforms utilize machine learning models trained on massive datasets to identify subtle behavioral changes that predict outcomes weeks in advance.
Key capabilities include:
- Pattern recognition comparing current behavior to historical churn/expansion cases
- Real-time risk scoring updated as users interact with your platform
- Predictive timeline modeling showing likelihood of churn/expansion over time
Intervention Automation
Once you've identified at-risk accounts or expansion opportunities, automated systems can trigger appropriate responses:
Churn Prevention Workflows
- Automated outreach to inactive team members
- Personalized onboarding campaigns for incomplete teams
- Escalation to customer success for high-value accounts
Expansion Acceleration
- Targeted feature recommendations based on usage patterns
- Department-specific use case presentations
- Executive stakeholder engagement for domain-wide rollouts
Measuring Success: KPIs for Your Analytics Program
Track these meta-metrics to ensure your team adoption analytics are driving business results:
- Prediction Accuracy: Percentage of churn/expansion predictions that materialize
- Intervention Effectiveness: Improvement in adoption metrics after triggered actions
- Revenue Impact: ARR attributed to analytics-driven interventions
- Time to Detection: How early you identify at-risk accounts vs. actual churn
Conclusion
Team adoption analytics represent the next evolution of SaaS metrics, moving beyond individual user tracking to understand the collaborative dynamics that drive platform success. By implementing comprehensive measurement across team completion, domain coverage, collaborative engagement, and adoption velocity, you create a predictive system that identifies opportunities and risks before they impact revenue.
The most successful customer success teams combine these analytics with automated intervention systems, creating a scalable approach to account management that grows with your platform. Start by implementing the four core metrics, build your dashboard with clear action triggers, and iterate based on prediction accuracy and business impact.
Remember: in collaborative SaaS, individual user success is just the beginning. True platform value emerges when entire teams adopt, engage, and expand their usage together.
Ready to transform your team adoption analytics? Start with team completion percentage tracking and build from there. Your future expansion revenue depends on the collaborative patterns you identify today.